UC Davis Medical Center COVID models
The UC Davis DataLab has been working with the UC Davis Medical Center (UCDMC) over the past several months to improve their models for predicting COVID-19. With a new surge of admissions underway caused by the Delta variant, accurate prediction of bed occupancy and admissions are important for planning and resource allocation amid changing conditions. The latest iteration extends the horizon of predictions from two days to seven and has reduced the error rate of predictions for admissions by 8%.
The first models for predicting COVID-19 admissions at UCDMC were created by the medical center’s Clinical and Translational Science Center (CTSC) in a crash program during the “third wave” of COVID-19 infections from December 2020 to January 2021. In order to feed their predictions, CTSC developed a list of 66 features that could be extracted from existing hospital databases and were considered possibly relevant to COVID-19 case counts in the near future. Some of those features were the number and positivity rate of COVID-19 tests administered within the hospital, the number of COVID patients receiving high-flow nasal oxygen, and the day of the week. While iteratively improving the predictions, DataLab has relied on the CTSC’s work in preparing this list of features.
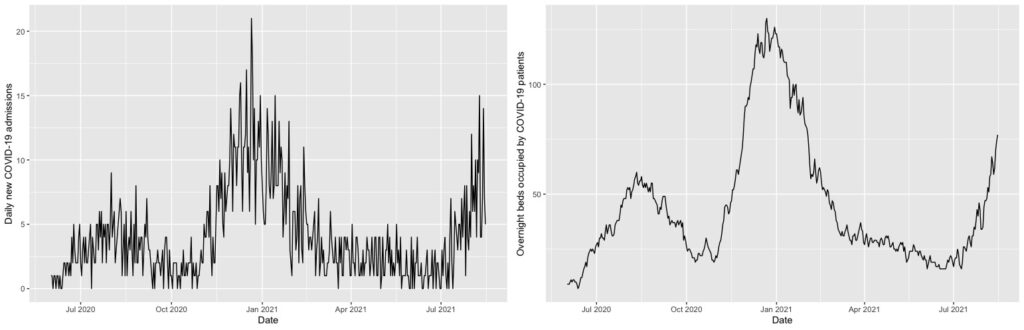
Possessing a large number of features but relatively few observations (data about COVID-19 admissions only goes back to 2020), DataLab employed its expertise in machine learning to do feature selection, variable transformations, and apply relevant algorithms to the different prediction targets: overnight bed occupancy and new admissions. For predicting the overnight bed occupancy, a linear regression model was chosen, using the so-called “LASSO” for feature selection. A LASSO (least absolute shrinkage and selection operator) first tries to prune all variables from a model so only the most influential remain. It does this by gradually decreasing the influence of less important variables until they have a coefficient of zero in the model. A square-root transformation was used to account for the bed occupancy counts being right skewed. This is a relatively simple model that is well suited to predicting the overnight occupancy because the number of occupied beds is quite consistent from one day to the next. You can see the relatively smooth change in the nightly bed occupancy data in contrast to new admittance in the plots shown in Figure 1. The DataLab approach made use of that consistency by using the prior night’s occupancy as one of the features in a linear model to predict that of the next night.
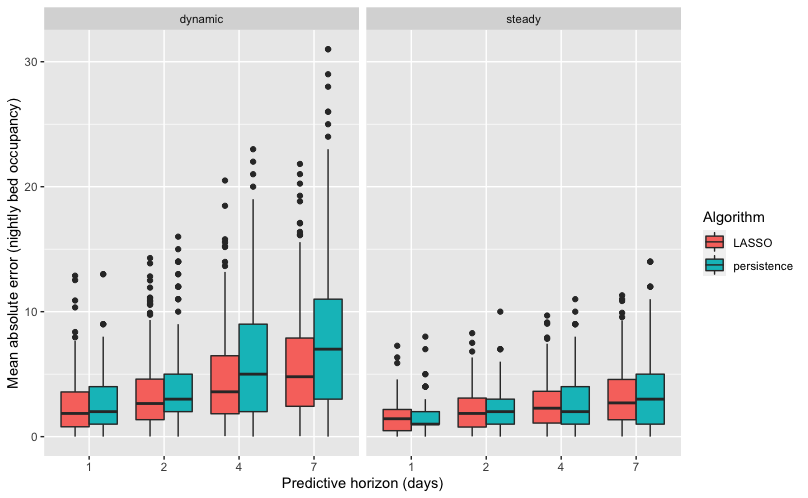
UCDMC was independently developing two new models to predict new admittance. The first of these was a LASSO model and the second a gradient boosted model. The LASSO model operated in the same way as the overnight beds model by the DataLab, and worked well with an average error in it’s average predicted admittance of only 1.56 people. You can see in the prediction plot that this model works significantly better during times of dynamic change such as surges due to new variants of COVID-19.
The number of daily admissions of COVID-19 patients is much less consistent than the number of overnight occupied beds. As a result, a linear model that uses the previous day’s admissions is not particularly useful for predicting admissions in the coming days. An approach that uses more features and allows a nonlinear connection to the outcome is appropriate in such a case. The second UCDMC model for admissions was a gradient boosted model (GBM), which averages an ensemble of regression trees to make predictions. To fit the individual trees in the ensemble, a GBM uses both bagging and boosting. Bagging creates an ensemble by training each individual regression tree on a randomly selected 50% of the input data. This helps avoid overfitting because the training data changes between trees. Boosting means that every time a new tree is added to the ensemble, it gives more weight to being accurate on the observations where the previous trees are the least accurate. These, combined with the inherent nonlinearity of regression trees, mean that a GBM is a very powerful and flexible method of making a predictive model. This model also performed better than the baseline, but was less effective than the LASSO model, with an average error of predicted admittance of 1.66 people per day.

The DataLab worked to build on the knowledge gained from the previous models to improve their performance. To predict the number of new admissions for COVID-19 in the coming days, DataLab elected to use a model similar to the GBM model by UCDMC, with some alterations. While the UCDMC model used all available variable, the DataLab model used only the 20 most powerful variables in terms of prediction. Additionally, the DataLab fine tuned the model parameters by using more trees regression trees with less individual weight in the final output than the UCDMC model. These changes allowed DataLab’s model to reduce the error rate of predictions by 8% to about 1.44 admissions per day.
That improvement is especially evident when looking at surges or lulls in COVID cases. While all models struggle to make predictions during unprecedented times, the DataLab performs better than the previous two when admittance rates are changing, as compared to consistent rates day to day. These are the times when an accurate prediction is most helpful for preparing adequate staffing levels. The extended horizon is also critical, as workers need more than one days notice to plan their own schedules. DataLab’s model performed better than the prior model for one day in advance, while our predictions for seven days out were as accurate as the prior model’s one day prediction.